Making Money by Random Investing. Ep. 1
The investment world is becoming increasingly complex and fragmented. Every day, new strategies, products, and "gurus" emerge, promising astronomical returns. But how effective is all this? What if completely random investing could be as valid as many other strategies?
The Modern Investment Circus
- Small caps, ex-something, commodities used for things you didn't know existed
- Increasingly exotic ETFs tracking niche markets in remote countries
- "University algorithms" presented as the new trading frontier
- Alternative assets like Pokemon cards and cryptocurrencies named after ducks
- Paid copy-trading on portfolios of kids who haven't finished high school yet
What If We Roll the Dice?
If the market is so unpredictable, why not fully embrace randomness?
That's how our experiment was born: "Random Stock-Picking on a Defined Market," a deliberately absurd strategy that challenges trading conventional wisdom.
How the Strategy Works
- Choose a reference market (e.g., Nasdaq100)
- Randomly select a stock from that market
- Invest a predefined amount
- Hold the position until we reach:
- A predetermined loss (e.g., -3%)
- A predetermined gain (e.g., +3%)
- Sell and repeat the process with a new random stock
Simulating Thousands of Parallel Universes
A Monte Carlo analysis allows us to simulate thousands of different scenarios starting from the same initial data. It's like seeing what would happen if we could repeat the same investment thousands of times in parallel universes.
To test our strategy, I developed a Python script that considers:
- Reference market (Nasdaq100 or NYSE100)
- Exit thresholds (minimum and maximum)
- Number of simulations
- Starting date
- Commissions (percentage and fixed)
- Initial capital
Simulation Results
First Scenario: Symmetric Thresholds (-3%, +3%)
Period: February 4, 2024 - February 9, 2025
Benchmark (Nasdaq100 ETF): +27.96%
The first simulation used these parameters:
- 10,000 iterations
- Market: Nasdaq100
- Thresholds: -3% and +3%
- Commissions: 0%
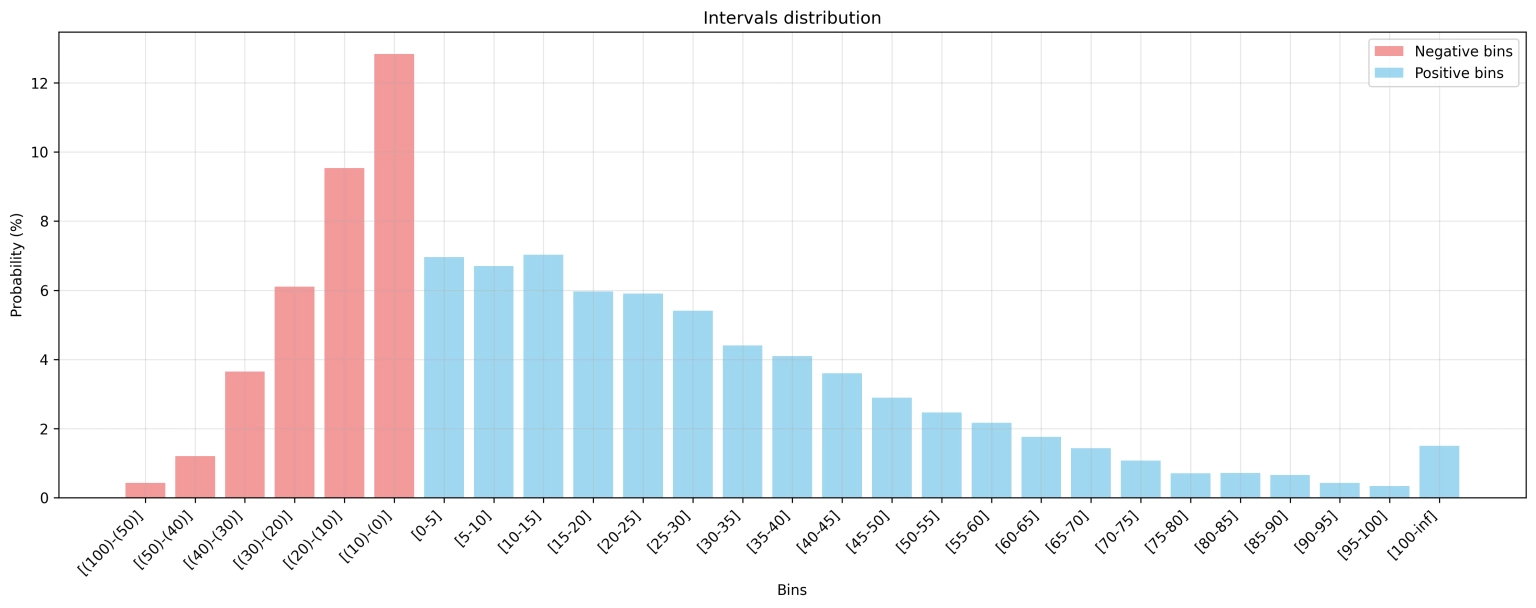
Results:
- Simulations beating the benchmark: 30% (3,038 cases)
- Positive performance: 66% (6,625 cases)
- Negative performance: 34% (3,375 cases)
- Risk of loss >20%: 11%
- Risk of loss >50%: <1%

Second Scenario: Let's Try Being More Optimistic
Keeping the same base parameters, we tried being more patient with losses and more ambitious with gains, using asymmetric thresholds:
Results with -1% and +5% thresholds:
- Simulations beating the benchmark: 24% (2,429 cases)
- Positive performance: 58% (5,790 cases)
- Negative performance: 42% (4,210 cases)
- Risk of loss >20%: 15%
- Risk of loss >50%: <1%

Third Scenario: When the Market Isn't Shining
After testing the strategy in a strong growth period, let's see what happens when the market doesn't offer the returns investors are used to. We chose the period between September 1, 2022, and May 14, 2023, when the reference ETF recorded almost no performance (+0.14%). We used the thresholds that gave the best results in the first scenario (-3%, +3%).
Results:
- Performance above benchmark: 55% (5,464 cases)
- Performance above 20%: 24% (2,442 cases)
- Negative performance: 45% (4,516 cases)
- Risk of loss >20%: 13% (1,347 cases)
- Risk of loss >50%: <1% (18 cases)

First Conclusions
1. Market Context Impact
The random strategy showed very different results depending on market conditions. In a bullish period (first scenario), only 30% of simulations beat the benchmark, while in a stagnation period (third scenario), the percentage rose to 55%.
2. Risk Management
Despite complete randomness, the strategy maintains a considerable risk profile. In all scenarios, the probability of losing more than 20% of capital oscillates between 11% and 15%. This is not a negligible risk.
3. Threshold Asymmetry
The second scenario, with asymmetric thresholds (-1%, +5%), showed worse performance than symmetric thresholds. This might indicate that transaction frequency is more important than profit target size.
4. Efficient Market Reflections
The fact that a completely random strategy can generate positive results in more than 50% of cases raises interesting questions about the efficient market theory and the real utility of many complex investment strategies.
Note that these simulations don't account for commissions, which vary significantly between brokers. Some brokers advertise "zero commissions" but compensate with wider spreads on transactions. In a real context, these costs could significantly impact results, especially considering the high frequency of operations in this strategy.
Next Simulations
In the next episodes, we'll try:
- New Thresholds: We'll test the strategy with different threshold combinations:
- Very tight thresholds (-1%, +1%)
- Very wide thresholds (-10%, +10%)
- More aggressive asymmetric thresholds (-2%, +8%)
- Thresholds with Commissions: We'll repeat the previous simulations adding typical transaction costs from popular brokers to see the real impact on the portfolio.
Important Disclaimer
This article has a purely educational and provocative purpose. It is NOT financial advice, and the described strategy should NOT be replicated with real money. Its purpose is to stimulate critical reflection on modern investment strategies and the role of randomness in financial markets.
Links
Python script: https://github.com/stecorte/random-stock-picking
Benchmark: Invesco EQQQ Nasdaq-100 UCITS ETF
Bonus: Pick a random stock